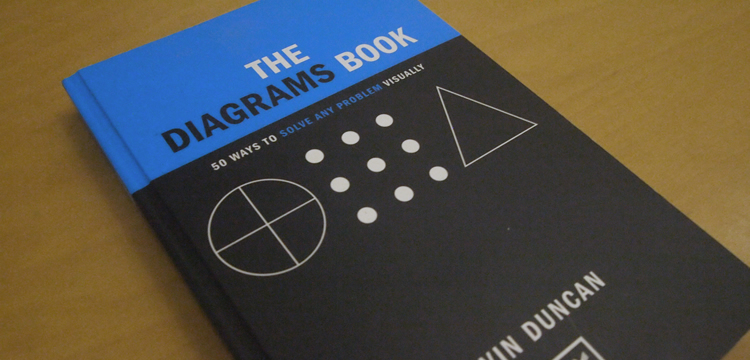
Reading list – The Diagrams Book by Kevin Duncan
This great little book is subtitled “50 ways to solve problems visually” and is a highly useful toolkit for people who like to approach problem solving using images and diagrams rather than words. It’s also an excellent resource to have at your disposal when looking about ways to present a concept to an audience in an engaging way.
The book features 50 diagrams arranged into 5 categories (Triangle and Pyramids, Squares and Axis, Circles and Pies, Timelines and Year views and Flows and concept) – there are some examples that everyone will be familiar with, such as the histogram and Pie chart, and some which are more unexpected, like the ‘cone’ or ‘loud hailer.’
The design is simple with a clear layout and very few words of explanation, it’s about keeping everything simple. You can just flick through when you’re looking for a way of expressing a concept and need a some inspiration.
We’ve used the ‘Market Map’ diagram (below) recently in an internal communication presentation for an IT company, they were thinking of ways of explaining how they’re positioned in the market relative to their competitors

A diagram such as this one gets the audience thinking about their own perceptions and is a useful way of starting a conversation. As an example of how this type of diagram can be used we’ve plotted the major supermarkets in the UK against two axis, value and quality, I hope this shows how a simple diagram can reduce complex ideas into an easy to understand format which get people thinking.

The Diagrams Book is short and to the point and the diagrams are useful for a wide variety of contexts, we highly recommend that you take a look. You can find out more about The Diagrams Book and Kevin’s other books here
